As the Senior Cloud Architect (and only cloud architect at Timehop), I’m responsible for making sure the infrastructure across Timehop and AdsByNimbus is operating smoothly. One piece of our infrastructure that has lots of visibility is ElasticSearch & Kibana. If one were to add Logstash they would have the highly popular ELK stack (ElasticSearch, Logstash, Kibana). In this blog post, I’ll dive into ElasticSearch, touch on Kibana, and ignore Logstash. By the end of this post, Cloud Architects/SREs/System Administrators will have a high level understanding of what it takes to prepare a production ready ElasticSearch cluster that can consume time series data that your end users can report on.
What is ElasticSearch and Kibana?
In the most simple terms, ElasticSearch (ES) is the system that stores your data and provides the ability to search that data quickly. Kibana is the visualization system that integrates with ElasticSearch. This presents users a friendly GUI in order to create reports and access to the raw data. (Note: If you happen to be on Amazon Web Services (AWS), they provide a service called “ElasticSearch” which is a managed service containing ElasticSearch and Kibana).
Fundamental Concepts
The basics of ElasticSearch need to be separated into data structures (in the broadest sense) and hardware components. The reason being that some software configurations are dependent on hardware configuration. We will see an example of this later.
Data Structures:
A document is a single “packet” of data, such as a json object. You store whatever data you need. For example:
{
  "timestamp": "Sep 16, 2020 @ 14:01:05.048"
  "first_name": "mark"
  "city": "new york"
  "event": "click text box"
}
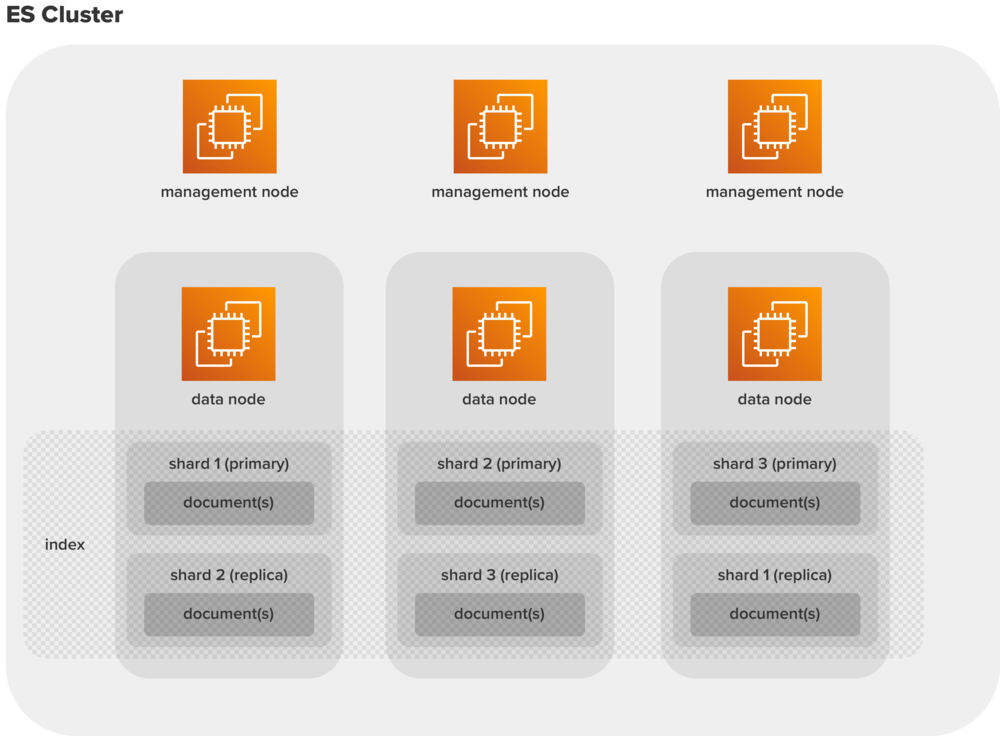
An index is a high-level construct that stores documents and is made up of shards. An end user can be (but may not necessarily need to be) aware of indexes.
A shard is a technical construct that helps create indexes across multiple nodes in an Elasticsearch Cluster. Documents exist in shards. There exist two types of shards: primary and replica. Primary shard is where data is actively written to, and the replica is a read only copy.
A replica is a backup copy of a shard that sits on a node other than where the “main” (primary) shard sits.
Hardware:
Data nodes store the data documents, indexes, shards, and replicas.
Management nodes help with the management of the ES cluster.
Getting Started
With an understanding of these basic concepts and their relationships, you’re ready to get started with ElasticSearch. Quite often as an administrator, one of the first questions you’ll run into is how to size and manage your indexes. Here are three best practices I have picked up from various sources (note this is not an exhaustive list; however, keeping it simple makes life easier):
Target 50 GB / shard
To keep search latency low you want to prevent the overhead of querying many small shards and keep a few larger shards. There’s a lot of discussion on how to size shards with ranges from 20 - 50GB. I have found 50GB to be acceptable.Keep 1 primary shard per node
The reason to keep 1 shard per node is to evenly distribute incoming data across nodes, which in turn keeps the read-write operations / node and CPU utilization / node at the same levels across servers.Target # active shards / vCPU <= 1
It is possible to have multiple active indexes in a cluster. This means you could have many shards on the node. In order to keep search latency down you want to be able to have the CPU power to do the search.
These best practices are not set in stone and can adjust based on use cases. But this list is meant as a reasonable starting point for the use case we talk about here. You may notice these best practices don’t deal with indexes, instead they exist at the shard level. The reason for that is because your ElasticSearch cluster can have 1 data node or 200 nodes, and an index lives across data nodes; therefore, giving any guidelines to indexes is tough because everyone’s environment is different. So best practices are at a shard level, and actual management is at the index level — so it’s up to the administrator to do the translation.
At this point you could theoretically setup an ElasticSearch with a couple of indexes that are properly sized for your environment. But what if you dealt with time series data that also expires? This requires a bit more index management and a few other tools provided by ElasticSearch.
Select Advanced Concepts
Before diving into a few advanced concepts, let's first define some important terms you’ll encounter:
An alias is an alias for an index or collection of indexes.
A template defines all the settings and mappings applied when creating new indexes, in effect, always keeps the alias pointing to the newest index and the search alias to all the indexes in the cluster.
An example config:
{
  "template": "index-*",
  "settings":
     {
        "number_of_shards":   3,
        "number_of_replicas": 1
     }
}
The Rollover Index API call is the mechanism/process that actually rolls the active index to a new index. This is where you specify the criteria for the index to be rolled-over such as the size of the index or the number of documents in the index.
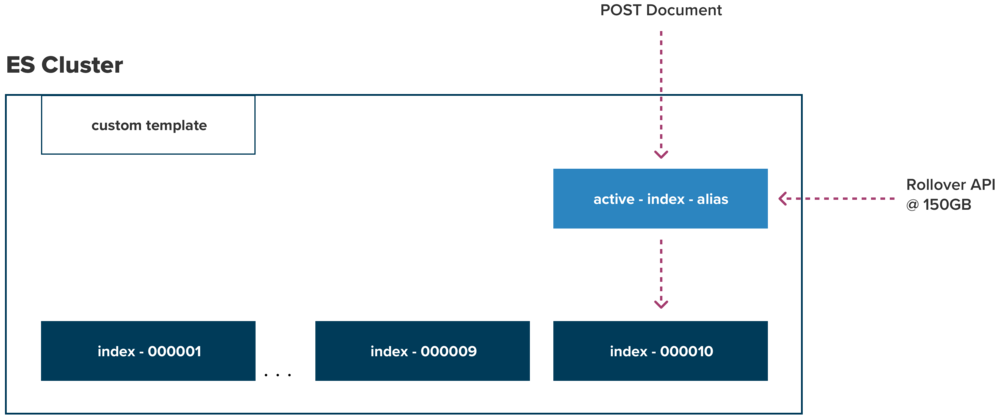
What you see in Figure 2 is a cluster with a template applied (as seen in template example above). This template makes sure all indexes with the name pattern “index-*” have 3 shards (assuming we have 3 nodes to keep with best practices #2 - keep 1 primary shard per node) and 1 replica. As time goes on, other systems keep adding data active-index-alias which in turn really places it into a real index (index-000010 in the diagram). However, we can’t just keep adding data to the index indefinitely, because it will break best practice #1 - target 50 GB / shard. The way to keep best practice #1 intact is via the Rollover API, which is configured by the administrator to roll the index when it reaches 150GB.
#shards * 50GB Max per Shard = Index Size
3 * 50GB = 150GB.
This is the translation the administrator needs to make based on the configuration of the cluster data nodes. You will also need to flush old data based on your requirements, because there is a limited amount of storage on your data nodes. At some point, index-000001 will need to be managed either by deleting it, or backing up somewhere else.
Conclusion
In the end, end users hit the Kibana visualization tool. They do not need to worry about shards or data nodes or rollover API. They just want to run reports on the data in the system with the understanding that there’s a limited amount of historical data. They can query the data using a variety of languages from Lucene to the newer KQL (Kibana Query Language) where they don’t necessarily need to know anything about the index information. However, in newer versions of ElasticSearch, there is a SQL interface available, which requires the knowledge of the index names as that is what’s used as the table name in the SQL “FROM” statement.
From the administrative side, there’s a bit of upfront work needed to understand what the requirements are as they may not necessarily be a sliding window of data like in this example. However, once the upfront work is complete and tested there’s a lot less (but rarely zero) maintenance work going forward.


