At TechByNimbus, we’ve put a tremendous amount of effort into designing smart infrastructure for rendering real-time reporting of revenue and impression data. This allows our end users, the publishers, to see how their mobile ad campaigns are performing in real-time, in contrast to the usual industry approach, which can take hours or days to get the users the data they need.
These days, due to the development of high performance technologies and advanced online services, internal and external data is moving faster than ever. Publishers have reached the point where monthly financial reports or even daily performance cycles are no longer enough. Fiscal information must now be available on-demand in order to optimize campaigns on the fly, turn partners on or off, and receive alerts for unusual statistics.
The Nimbus dashboard is designed to adapt real-time reporting and how it processes data as quickly as it is received on the server-side. In this post, I’ll go over the top technologies Nimbus is using, like Elasticsearch by AWS, crons on the back end, and React modules that invoke live data to be rendered by the minute on the UI.
What is the Real-Time Reporting on Nimbus anyway?
To understand the complexity of storing live data, let’s start with understanding what kind of events we handle to begin with, and how often we have to write and read them.
Nimbus’ data flow has two main data events: The Pre Auction, which includes the request event, and the Post Auction, which includes the win event and the impression event.
1. Pre Auction Data:
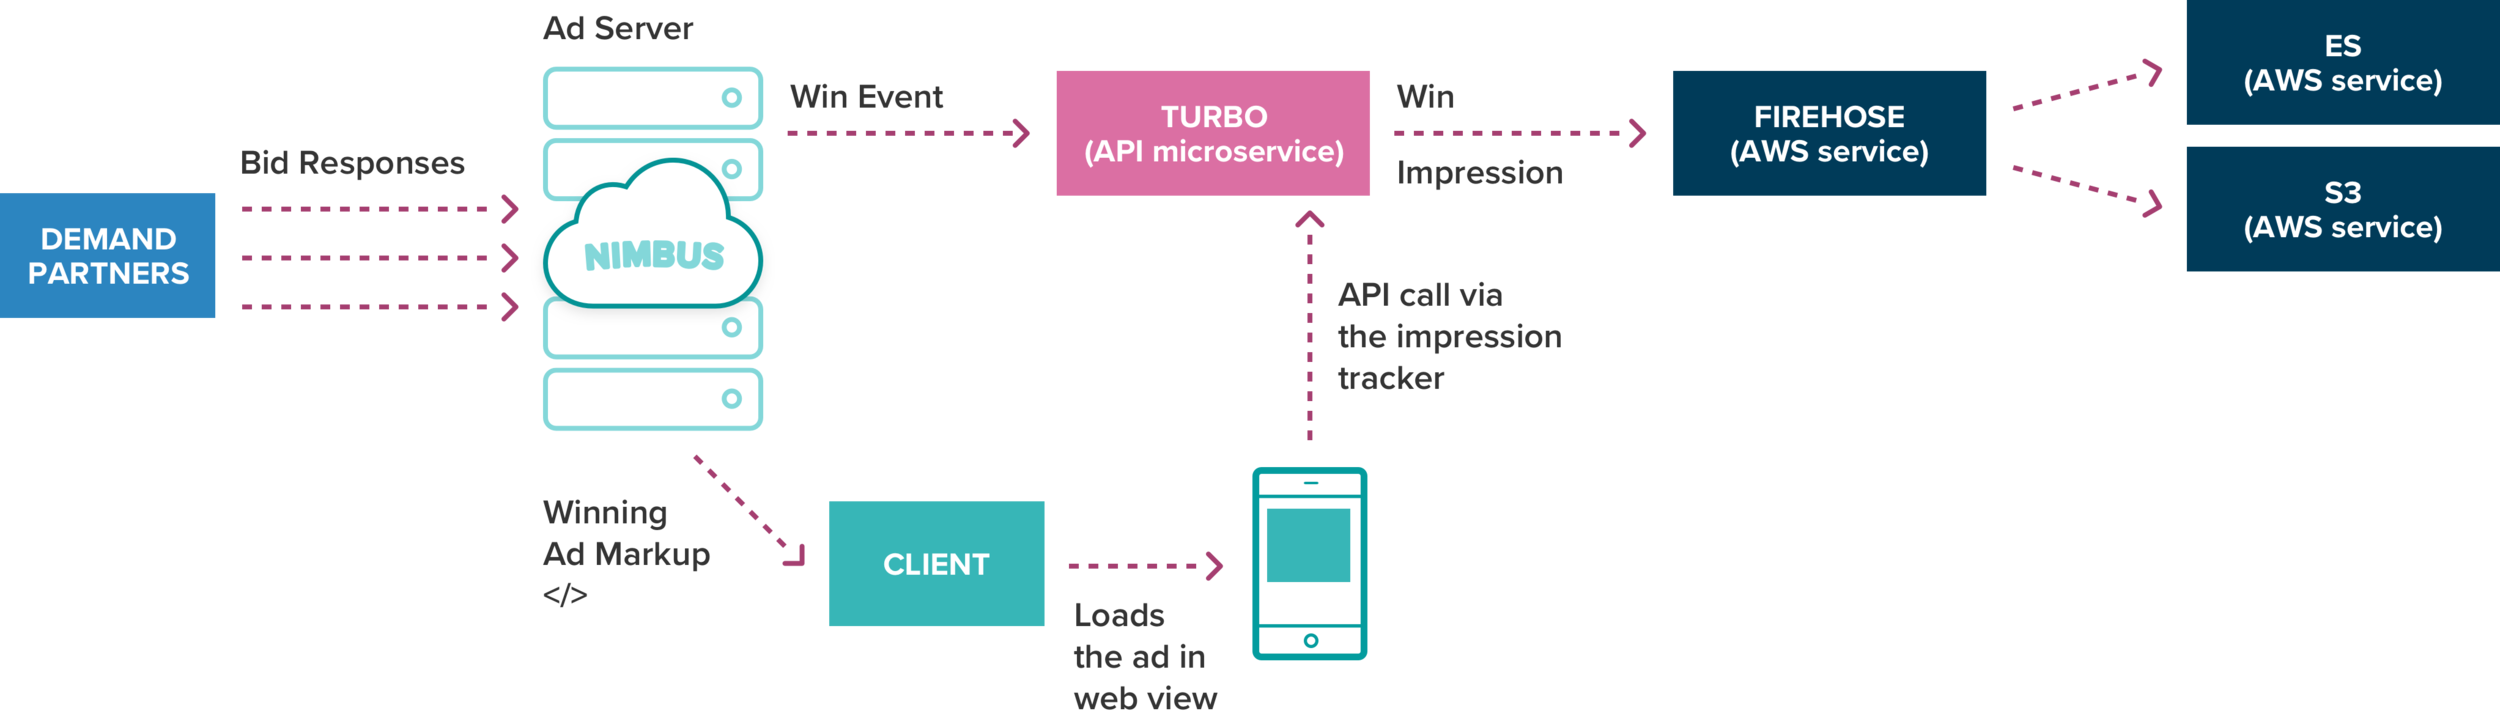
Things kick off when our publishers are looking to render an ad in a “real estate” area on their app. Once a user reaches an ad spot in the app, it sends an RTB request to the Nimbus server to run an ad auction on the publisher’s behalf. This is the first event we want to store - each request the client sends: Who is the publisher, what is the ad placement, time, device type, etc. Once Nimbus gets the request event, it processes it into a protocol buffer and sends it to Turbo - a microservice we use to handle all the API requests for storing the report’s data. From here, Turbo simply sends the data to Kinesis Data Firehose - a service by Amazon to reliably load streaming data into data stores and analytics tools. We chose to use Firehose to capture, transform, and load our streaming data into Amazon S3 and Amazon Elasticsearch Service.

2. Post Auction Data:
After the request event is fired, Nimbus runs an auction on behalf of the publisher across all its demand partners. The auction yields two important data sets we need to store:
The event of winning an auction - Once an auction is completed, a winner is declared and a bid response is generated by Nimbus with the winning ad. Nimbus then sends the winning event to Turbo to record the winner of the auction.
Retrieving ad with bid response - The next step is to load the ad by using the winning audience network SDK on the user's device, and then passing it the payload from the bid response. To get the complete cycle of the auction, we need to track its final goal - whether or not the user saw the winning ad on their device (note that there are several cases where ads fail to render like the ad’s creative doesn’t match the size of the ad slot, the ad renders a blank creative, etc.)
To track the ad impression event, we inject an impression tracker into the winning ad and wrap it together with the ad response as an Ad Markup. The impression tracker is basically an API call to Turbo that is sent automatically on the client-side once the ad is rendered successfully.
Making Enterprise Data Available in Real-Time with Elasticsearch
There is a lot of raw data coming into our system constantly. Our machine-generated data is growing exponentially with every new publisher using the Nimbus ad server. It’s important to get our clients the insights they need, so we needed to come up with a solution to aggregate this huge amount of data while keeping up the best performances using the right query language, visualizations, indexing, etc.
The team at TechByNimbus had been using Elasticsearch on Timehop for tracking direct ads data reporting. We were familiar with its great features and decided to use this service as part of Nimbus’ stack as well. Elasticsearch has emerged as a popular open-source choice to collect this valuable data. Having said that, deploying, managing, and scaling Elasticsearch manually can be challenging. This is why we use Amazon Elasticsearch as a fully managed service that makes it easier for us to manage our elasticsearch clusters at bigger scales. Amazon Elasticsearch supports Elasticsearch open source APIs and seamlessly integrates with popular data injection as part of the ELK Stack (Elasticsearch, Logstash, Kibana). By using this, we get all the benefits of Kibana included, enabling us to interactively explore, visualize, and share insights through our data. The alternative services to Elasticsearch, such as MongoDB, Splunk, Cassandra, and Solr, all require more resources to setup and maintain, without providing the same benefits and feature-sets. Elasticsearch allows us to use our existing code and tools to extract insights quickly and securely.
Using Crons on the Nimbus Dashboard Backend:
Our next step was to integrate the Elasticsearch data into a one-stop dashboard that aggregates all the ad event data per publisher into one page. We wanted to create a simple platform for our publishers that queries the data in Kibana to provide those same visual and analytical benefits we had access to.
What we built is essentially an anti-pattern flow, since many other use-cases take data from MySQL and push it to Elasticsearch for indexing. We did it in the opposite direction because it's more useful to us in a raw, schemaless format. Then, the data is aggregated in MySQL for easy retrieval.
The Nimbus Dashboard is managed via another microservice: meet Beau. Beau’s backend is built on Go. The gathering of real-time data from Elasticsearch to our MySQL database is running constantly via goCron:
goCron is a Golang job-scheduling package which lets you run Go functions periodically at predetermined intervals using a simple, human-friendly syntax.
Using this super friendly library, we simply pull our data every minute by defining a reporting job routing function. We start by setting the cron.go file - this is where you can set all the cron functions that you need to run on production. For the reporting job we set the scheduleReportingJob function. Now, the gocron->Start() command is tasked with calling all of its scheduled jobs per their configurations, which are defined by every call to gocron.Every(...)
package importers
import (
   "github.com/marcsantiago/gocron"
)

type reportingJobConfig struct {
   importFreqMinutes    uint64
   trueUpFrequencyHours uint64
}

// StartProdMode ...
func StartProdMode() {
   scheduleReportingJob(reportingJobConfig{
       importFreqMinutes:    1,
       trueUpFrequencyHours: 12,
   })
   ...
  <-gocron.Start()
In our example, the live reporting scheduled job is defined inside the function scheduleReportingJob- this is where we execute the importAllPublishersReportingDataForToday method every minute:
func scheduleReportingJob(config reportingJobConfig) {// Import today's data every minute to mimic real-time statserr :=gocron.Every(config.importFreqMinutes).Minute().Do(ImportAllPublishersReportingDataForToday
ImportAllPublishersReportingDataForToday is responsible for retrieving the data from ElasticSearch and denormalizing it into a relational data model to store and retrieve: the function loops over all Nimbus’ publishers, and uses the ElasticSearch client to send a search() query to retrieve the reporting data for each of them:
response, err := esClient.Search().SearchSource(searchSource).Index(index).Do(ctx)
The searchSource is an instance of an ElasticSearch query represented by an object from the github.com/olivere/elastic package. It contains all the data necessary to query the ES cluster, including aggregation and sub-aggregations, time range, and publisher metadata.
Finally, we create a data model to represent the denormalized relational data provided by the ElasticSearch response and store it in the Beau database for future retrieval.
By configuring the ElasticSearch cluster to be write-optimized and querying it asynchronously, we were able to configure the MySQL database tables and index for a read-optimized access pattern, which decoupling the individual concerns of each operation. As a result, we can run the import function as the goroutine for each of our publishers, and ensure the live data can be upstream from ElasticSearch to the Beau database every minute, all day long.

Using the Event Interval on React to re-render real time data on the Nimbus Dashboard UI:
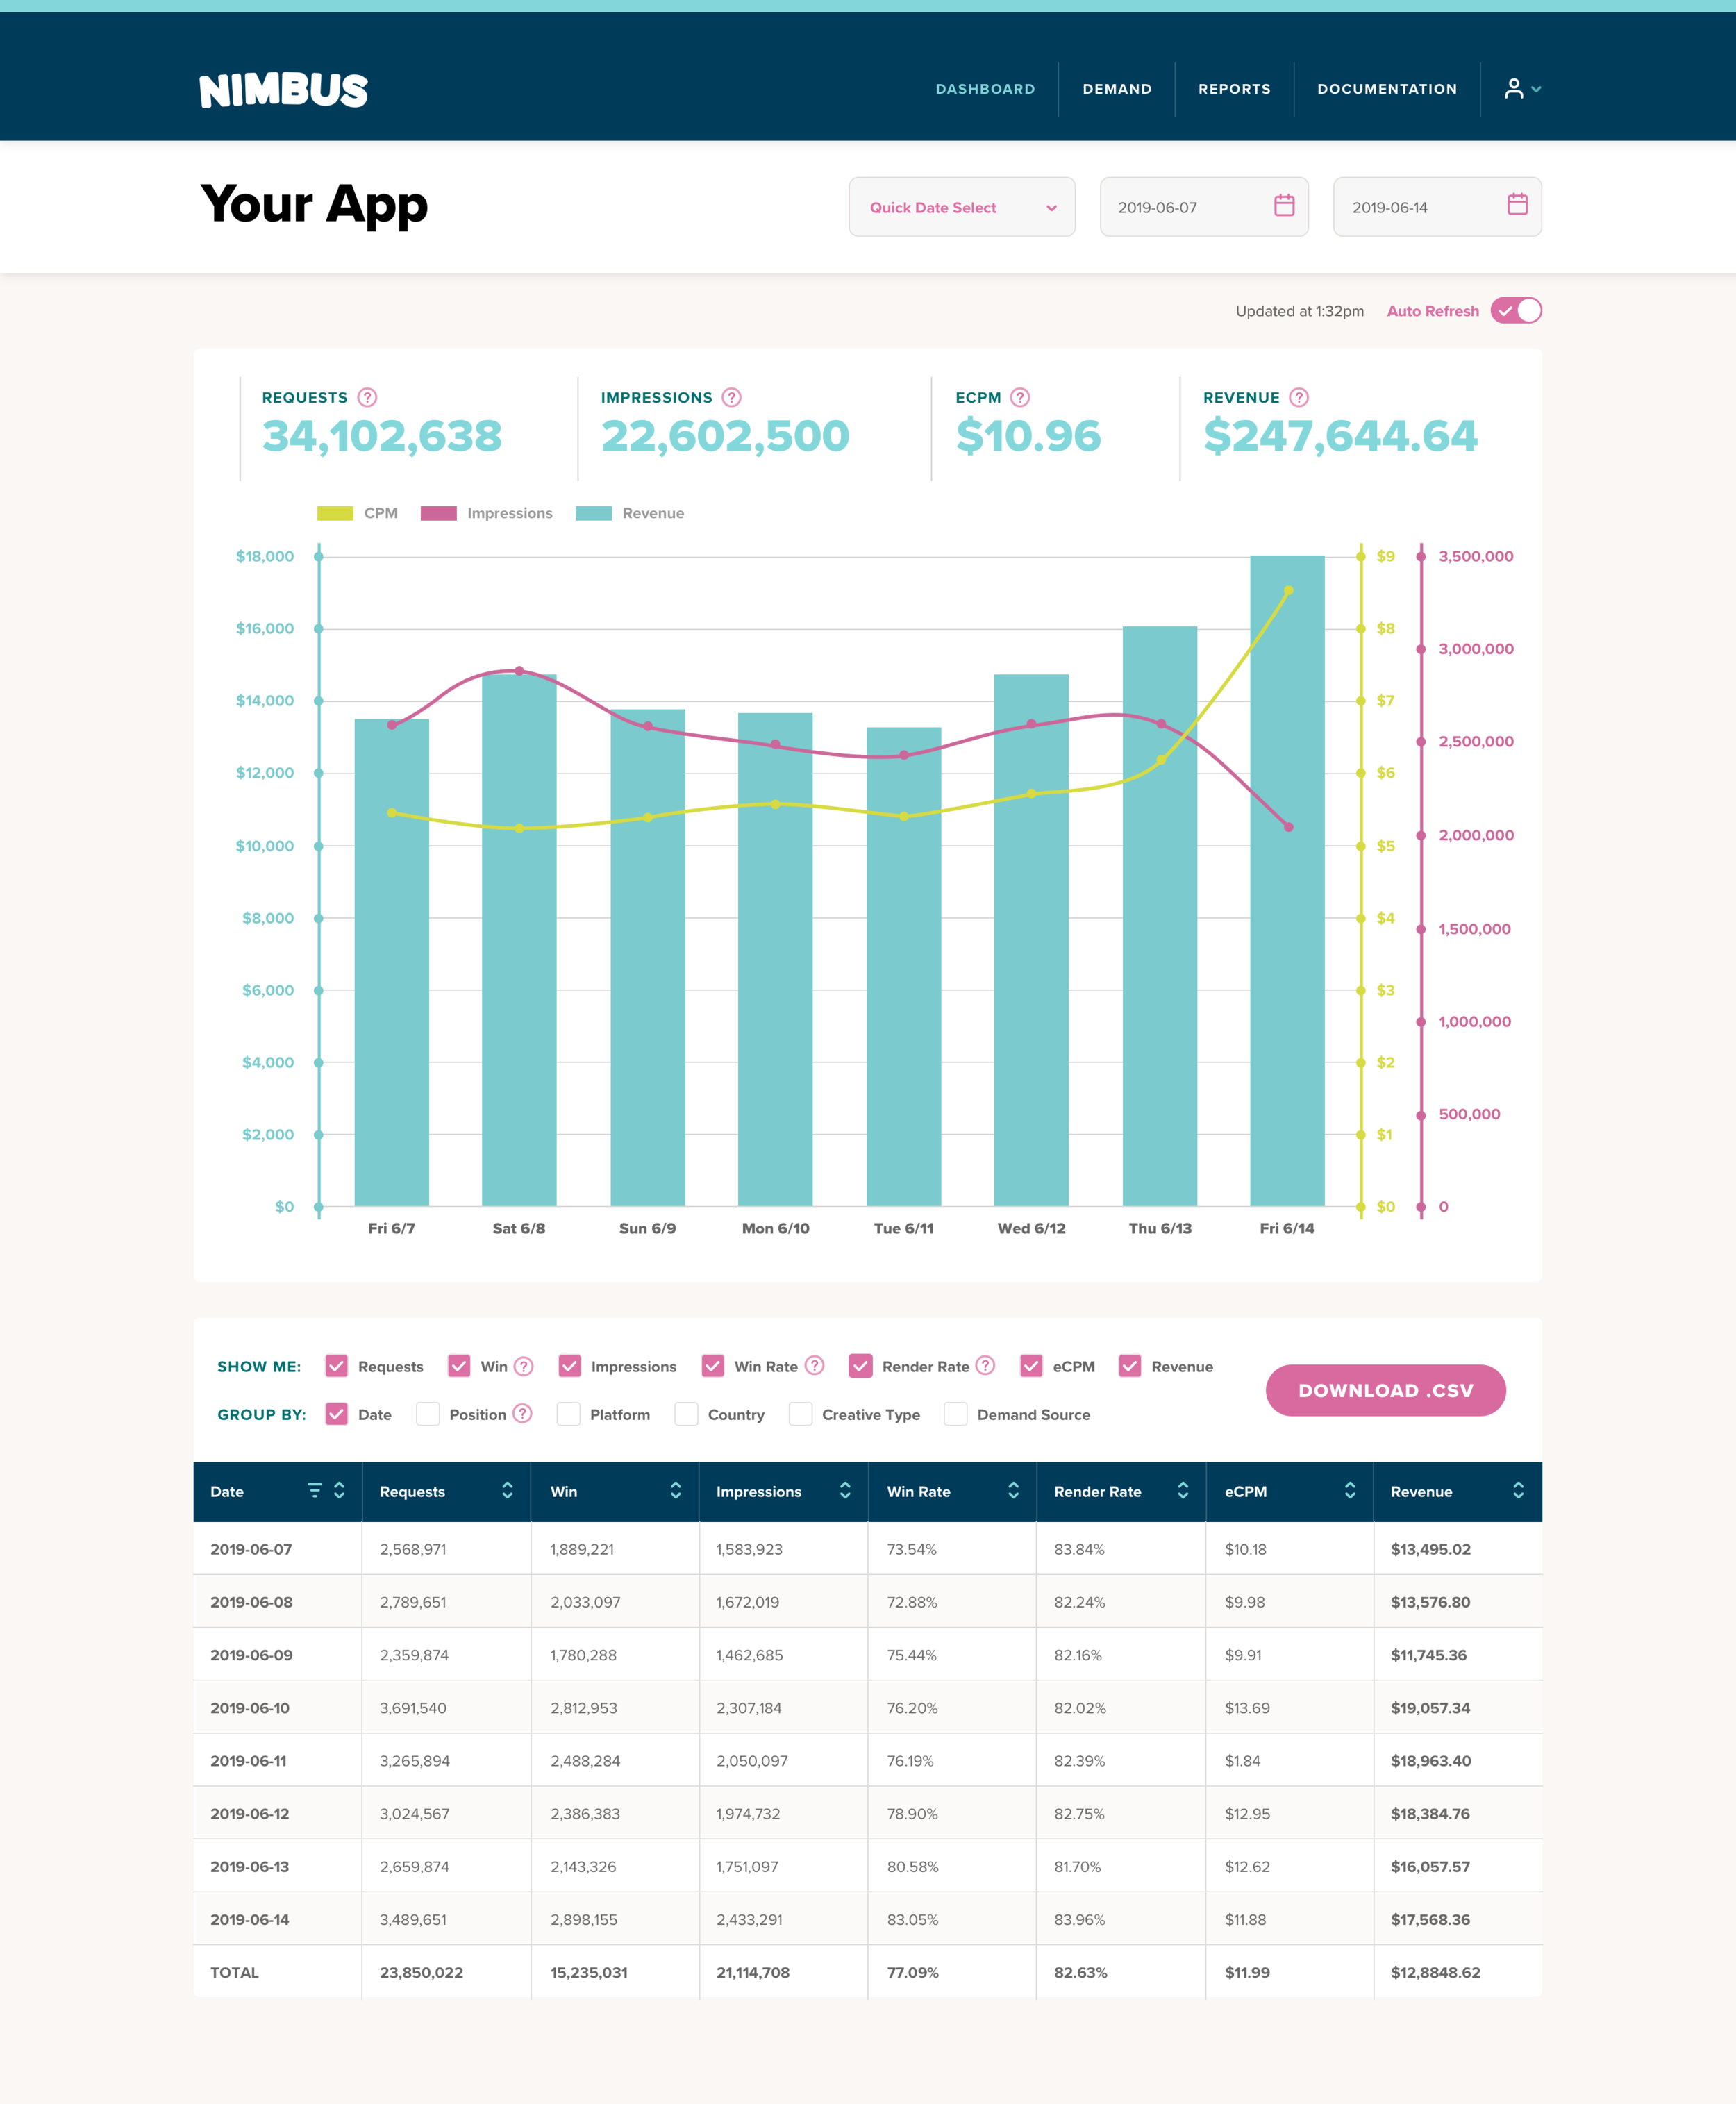
The Nimbus Dashboard page is an easy-to-use analytical tool that aggregates all the reporting data across all of the publisher’s integrated demand partners. This way, our publishers don’t need to monitor their ads’ performances across different partners’ platforms - the Nimbus dashboard manages it all under one simple page.
So finally, how does the Nimbus dashboard UI update the campaign's data every minute? By using the React framework, we built the dashboard component that renders three main children components:
<AutoRefreshSwitch>

A component that renders the auto-refresh switch element. This is where the users can define if they want to track the live data automatically. If the switch is set to on, it triggers a JS event interval that simply updates the updatedAt state on its parent Dashboard component every minute (60000 ms):
// If the refreshInterval is set to true -// update it every minute:if (refreshInterval) {refreshInterval = setInterval(() => {this.setState({ updatedAt: moment().format('h:mm a') });}, 60000);}// If the refreshInterval is set to false -// stop the current intervalelse {clearInterval(this.state.refreshInterval);}
<DashboardChart> , <DashboardTable>
These components translate the raw data into a visual chart and table. Both components are set to re-fetch data using the React.useEffect hook method every time the publisher keyword /start date/ end date or updatedAt props are changed:
React.useEffect(() => {fetchChartData();}, [publisherKeyword, startDate, endDate, updatedAt]);
As mentioned earlier, the <AutoRefreshSwitch> component updates the updatedAt state on the main dashboard component every minute. Meaning the dashboard component is rendered every minute and sends a new updatedAt prop to both Chart and Table components. The useEffect on the children components is also triggered every minute (since updatedAt is one of the parameters useEffects tracks). The fetchChartData function on both components is called, sends an API GET request, and updates the component’s state with the response data every minute. Since the data on the backend is also updated every minute, all the front-end components are constantly receiving live reports on each API call.
Once the data is fetched and updated, the user can now use all the in-house benefits of our dashboard: View, sort, group by, and filter the real-time reports to create the snapshot they want. Users can track every piece of Nimbus data by demand source, country, platform, placement, and more. Nimbus dashboard gives our users all the data they need to ensure they are collecting every dollar earned from their demand partners.
Wrapping Up:
Rendering real-time data is a vital feature not just in the ad tech world, but in any industry. The good news is, there are many services that can easily help your engineering team get there. Being familiar with a specific service or package (like we were with AWS Elasticsearch, Kibana, and goCron package) is extremely beneficial and can save you a huge amount of prep time. That being said, it’s still critical to understand your product’s data flow. Deciding which data you want to store, and which you want to ignore is imperative, because storing real-time data can be super expensive.
Double check that your services provide you with the best practices for your current needs, but always keep in mind your scale-up options (will the service still be productive when scaling up, or would I have to transfer to a new service?) This is important and can save your team endless work when it comes to enterprise data. Finally, set up and manage your infrastructure, indexing, data aggregation, and API endpoints to gain maximum performance from your query.
We learned a lot by using these technologies, and even though it was a big challenge for our engineering team, it was an even bigger opportunity for us to pick each others’ brains. Our engineers got to learn a little bit about each part of the stack’s best practices to render on-demand data, and the result was a more complete understanding of the Nimbus dashboard flow.


